
There are times the Azure integration components such as Logic Apps, function Apps, fail due to technical errors, functional errors or data errors. There should be a mechanism to monitor and pro-actively inform the technical owners or functional owners about these errors, to have a successful and reliable integration. This blog provides a mechanism for the following errors:
- Monitoring solutions
- Handling Functional or Data related Errors
- Handling Technical Errors
- Tracking the integration flow errors
Azure Integration: Monitoring using Logic App Management solution
Logic Apps Management monitoring solution leverage services in Azure to provide additional insight into the operation of a Logic App execution. This Monitoring solution collects Logic App execution log data and provides queries and views to analyze collected data.
- The solution gives a more detailed view and visualization of all your logic apps with the Logic Apps Management Solution on Azure Operations Management Suite (OMS), which includes tracking of custom queries, success and failure graph trends, Power BI report generation and a timeline of your runs, actions, triggers, and failures.
- The solution also lets Admins resubmit the Failed Logic App Runs
- It enables the technical owner to export all the exceptions to analyze and identify the most common errors. Then Azure Integration owner can come up with remediation action and make the integration more reliable and robust.
The following diagram shows the Logic Management Solution. This shows the summary of the execution of Logic App Runs. It provides an option to see the Logic Apps run for different periods of time such as the last 24 hours, 48 hours, 7 days, 30 days.

Once you click on the diagram, which takes you to the detailed view of the Runs. It provides options to filter the run based on different options such as status, Logic App Name, Run Id, Execution time. It also provides an option to select Multiple Runs and re-submit the Logic App runs.

What is Log Analytics Workspace?
Log Analytics Workspace is a service which collects data from a set of different sources. These data are organized into tables created automatically. From that point and forward we can monitor, analyze, visualize and create alerts for that data.
- The Agents send telemetry data, Logs from each Data source to Log Analytics service
- Log Analytics service collects data and classifies the data into different tables
- With several tools, the End User can monitor, analyze, create reports, dashboards, alerts based on the data.
Azure Integration : Setup Logic App Management Solution
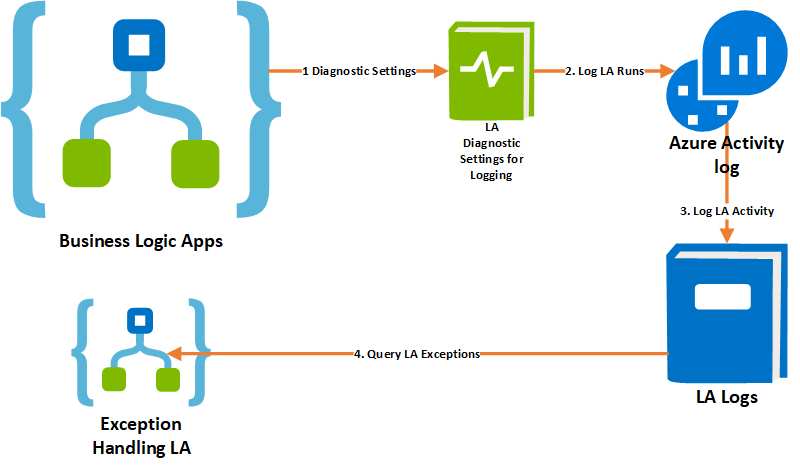
The following diagram shows in high level to set up a Logic App Management solution in Azure Portal.

- Create a Log Analytics WorkSpace to store the data.
- Connect a Log Analytics workspace to Logic App Azure Subscription to Collect data regarding the Logic Execution Runs.
- Add the Diagnostics settings in Logic App to send Logging to Log Analytics works space
- After setting up diagnostics, connect the Diagnostic setting to the workspace to send the Logic App execution details
- Add the Logic App Management Solution to Log Analytics Workspace. This would collect the data from Azure Logs and visualize the execution Details.
Azure Integration:Handling Functional or Data related Errors
There are times the Azure integration logic fails due to incorrect data on the source or target system. The errors arise due to functional error or data error and it will be ideal to forward these errors to functional leads to correct the data on the source or the target. These errors should be fixed either in the source or target system and re-submit the request again to ensure the successful execution of the integration logic.
The approach is to analyze the most common data errors from the current production system and identify the places where most errors occur. Then implement a centralized exception handling mechanism. The best way to get this information is by using Azure Log Analytics.
All the Logic App Actions which could potentially fail due to incorrect data will have an action to handle the failures. This action would forward the error messages to a central Logic app for handling the exception. The exception handling logic app would log these exceptions to Azure Activity Log for monitoring and optionally would send the mail to corresponding functional heads to correct the data.

The example of handling an exception while saving information to a third party application is shown below in the diagram. The failure action would call the central exception handling logic app and send the required information.

The information which needs to be sent can be defined based on the Azure Integration scenarios. I sent the following information, which then can be used to Log in to Log analytics and send emails to Functional or technical owners.
1. Detailed Error Message. This can be retreved using outputs(‘Previous Action Name’)
2. Error Message:This can be retreved using outputs(‘Previous Action Name’)[‘body’]
3. Input Message to the Previous action:This can be retrieved using body(‘Previous Action Name’)
4. Status code of the Previous Execution: outputs(‘Previous Action Name’)[‘StatusCode’]
The exception Handling action has been configured to run only when the previous execution has failed
The Configure Run after option provides the option to run only when the previous action has been failed. The following actions after the execution handling block need to be configured to Run after when the previous action is Successful or is skipped.

Azure Integration: Technical exception Handling
Once Azure Integration has been deployed, it is necessary to get notifications about failures or other possible problems. The Logic App lets users set up alerts. For example, you can create an alert that detects “when more than five runs fail in an hour”. This alerting capability is limited and needs to be set up per logic. There would need to send out actual error messages, apply some logic and formatting to exceptions. This is not supported by OOTB Alerting functionality. This can be achieved by querying the Azure Log Monitoring in the Logic App and apply the required templating / process logic to send the information. I use the following approach to get notification of the failures of all the Logic Apps and use single Logic APp to handle the exceptions.
I use the Query Azure Monitoring Log Actions from Logic Apps.
search Category == ‘WorkflowRuntime’ | where status_s == “Failed” | where Level == “Error”

Tracking Azure Integration Runs
Azure Logic Apps has some additional capabilities beyond the out-of-box capabilities for Tracking custom properties, these are called Tracked Properties. The tracked properties could be a vendor account in Dynamics 365 UO integration and or an account number in Dynamics 365 CE integration, which would help us to follow the end to end integration flow. These additional capabilities are unlocked by enabling diagnostics for a logic app and publishing the data to Log Analytics.
In the Azure Logic App, from the Settings option within each action, there is a Tracked Properties setting where static or dynamic values can be included based upon Logic Apps Workflow Definition Language.

With a Log Analytics workspace configured, and diagnostics configured within our logic app, we will see diagnostic events emitted to Log Analytics. If the Tracked Properties are configured, then the next time we run our logic app, we will find our custom diagnostics included in our Log Analytics data.


2 thoughts on “Azure Integration: Tracking, Exception Handling and Monitoring of Azure Logic App”